NHL
Feb 02
Final
BUF
3
FLA
6
Final
OTT
4
PIT
1
Final
NYI
5
WSH
4
Final
/OT
MTL
2
MIN
3
Final
/OT
STL
3
NSH
2
Final
/SO
SJS
3
CHI
2
Final
WPG
4
DAL
1
Final
DET
3
COL
5
Final
VAN
5
UTA
2
Final
TOR
3
CGY
1
Feb
3
Tuesday, Feb 3
BUF
TBL
Tuesday, Feb 3
CBJ
NJD
Tuesday, Feb 3
PIT
NYI
Tuesday, Feb 3
WSH
PHI
Tuesday, Feb 3
OTT
CAR
Tuesday, Feb 3
TOR
EDM
Tuesday, Feb 3
SEA
ANA
Home
Scoreboard
Schedule
Standings
Trades
Trades
New Trade
Confirm Trade
Pending Trades
League
Team/GM
Finance
Salary Cap
Finance
Sponsors
Line Combinations
Entry Draft Projection
Captains
Coaches
Signings
Rulebook
Teams
Eastern Conference
Boston Bruins
Buffalo Sabres
Carolina Hurricanes
Columbus Blue Jackets
Detroit Red Wings
Florida Panthers
Montreal Canadiens
New Jersey Devils
New York Islanders
New York Rangers
Ottawa Senators
Philadelphia Flyers
Pittsburgh Penguins
Tampa Bay Lightning
Toronto Maple Leafs
Washington Capitals
Western Conference
Anaheim Ducks
Calgary Flames
Chicago Blackhawks
Colorado Avalanche
Dallas Stars
Edmonton Oilers
Los Angeles Kings
Minnesota Wild
Nashville Predators
San Jose Sharks
Seattle Kraken
St. Louis Blues
Utah Mammoth
Vancouver Canucks
Vegas Golden Knights
Winnipeg Jets
Stats
Individual Leaders
Advanced Stats
Player Stats
Goalie Stats
Team Stats
Franchise Leaders
Career Stats
Regular Season
Individual Leaders
Player Career Stats
Goalies Career Stats
Team Career Stats
Play-Off
Individual Leaders
Player Career Stats
Goalies Career Stats
Team Career Stats
League Records
League Records
Records By Team
Players
Injury Report
Hot And Cold Players
Three Stars Race
NTCs
Contracts
Unassigned
Players
Goalies
All Players
Players
Goalies
Prospects
History
Awards
Seasons
All-Star Game
2024
2023
2022
2021
2020
2019
2018
2017
2016
2015
2014
2013
2012
2011
Draft History
Draft 2025
Draft 2024
Draft 2023
Draft 2022
Draft 2021
Draft 2020
Draft 2019
Draft 2018
Draft 2017
Draft 2016
Draft 2015
Draft 2014
Draft 2013
Draft 2012
Draft 2011
Draft 2010
Trades
Summer Cup
2020
2022
News History
AHL
Scores
Standing
Teams
Schedule
Individual Leaders
Player Stats
Goalie Stats
Teams Stats
Tools
All Rosters
Search
Bidding Systems
Players
Coaches
Calculators
Salary Calculator
Players Calculator
Players Calculator 2.0
Prospects Calculator
Players Compare
Reasonable Players
Make a Request
Lines
League File
Upload Lines
Web Client
Forum
Philadelphia Flyers
13-33-8, 34pts
· 16
th in Eastern Conference
Home
Roster
Schedule
Statistics
Trades
Lines
Prospects
Draft Picks
Depth Chart
Salary
Injuries
History
Hall of Fame
Farm
Game Center
Flyers
13-33-8, 34pts
1
3
Final
Bruins
28-24-4, 60pts
Team Stats
OTL1
Streak
L1
8-16-3
Home Record
14-15-1
5-17-5
Away Record
14-9-3
1-8-1
Last 10 Games
4-6-0
2.37
Goals Per Game
3.00
3.65
Goals Against Per Game
2.91
17.83%
Power Play Percentage
18.87%
80.45%
Penalty Kill Percentage
85.06%
Kings
32-14-9, 73pts
3
2
Final (OT)
Flyers
13-33-8, 34pts
Team Stats
W1
Streak
OTL1
13-8-4
Home Record
8-16-3
19-6-5
Away Record
5-17-5
6-4-0
Last 10 Games
1-8-1
3.20
Goals Per Game
2.37
2.85
Goals Against Per Game
3.65
21.15%
Power Play Percentage
17.83%
81.60%
Penalty Kill Percentage
80.45%
Capitals
16-34-7, 39pts
Tue, Feb 03
Wells Fargo Center
Flyers
13-33-8, 34pts
Team Stats
L2
Streak
OTL1
8-20-1
Home Record
8-16-3
8-14-6
Away Record
5-17-5
0-7-3
Last 10 Games
1-8-1
2.46
Goals Per Game
2.37
3.58
Goals Against Per Game
3.65
15.58%
Power Play Percentage
17.83%
75.68%
Penalty Kill Percentage
80.45%
Senators
27-27-1, 55pts
Thu, Feb 05
Wells Fargo Center
Flyers
13-33-8, 34pts
Team Stats
W1
Streak
OTL1
14-14-0
Home Record
8-16-3
13-13-1
Away Record
5-17-5
5-5-0
Last 10 Games
1-8-1
2.85
Goals Per Game
2.37
2.95
Goals Against Per Game
3.65
20.12%
Power Play Percentage
17.83%
81.40%
Penalty Kill Percentage
80.45%
Flyers
13-33-8, 34pts
Wed, Feb 25
Capital One Arena
Capitals
16-34-7, 39pts
Team Stats
OTL1
Streak
L2
8-16-3
Home Record
8-20-1
5-17-5
Away Record
8-14-6
1-8-1
Last 10 Games
0-7-3
2.37
Goals Per Game
2.46
3.65
Goals Against Per Game
3.58
17.83%
Power Play Percentage
15.58%
80.45%
Penalty Kill Percentage
75.68%
Team Leaders
GOALS
Shane Pinto
13
ASSISTS
Shane Pinto
29
POINTS
Shane Pinto
42
DEFENSEMAN
Jalen Chatfield
24
PIM
Marcus Foligno
111
PLUS/MINUS
Dennis Gilbert
1
WINS
Frederik Andersen
7
SV%
Frederik Andersen
90.5%
Team Stats
Goals For
128
2.37 GFG
Shots For
1485
27.50 Avg
Power Play Percentage
17.8%
23 GF
Offensive Zone Start
37.3%
Goals Against
197
3.65 GAA
Shots Against
2039
37.76 Avg
Penalty Kill Percentage
80.5%
52 GA
Defensive Zone Start
45.4%
Team Info
General Manager
Milan Splichal
GM Since
October 2023
Head Coach
Ryan Warsofsky
Conference
Eastern Conference
Division
Metropolitan Division
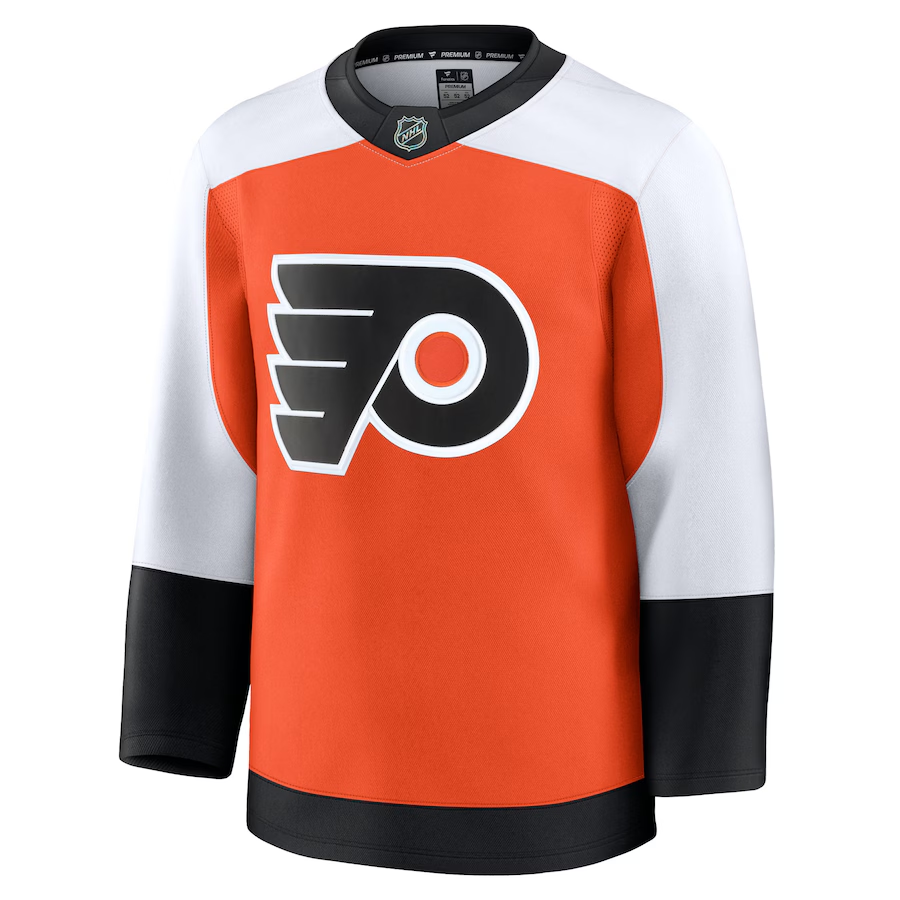
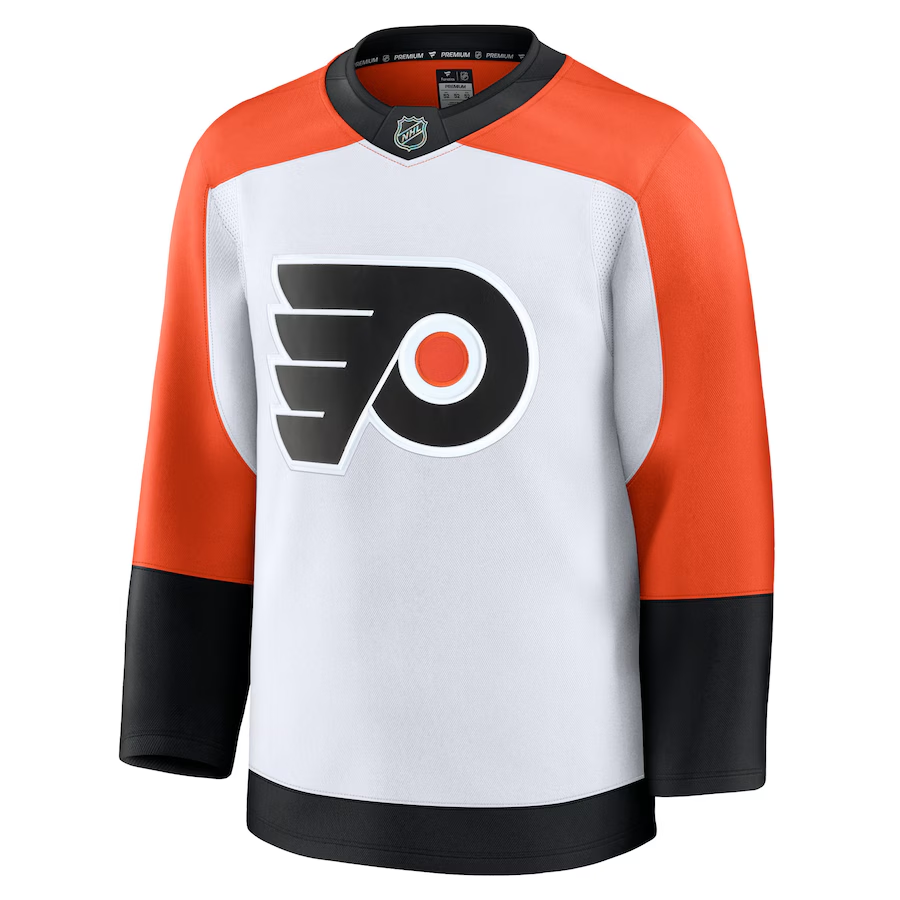
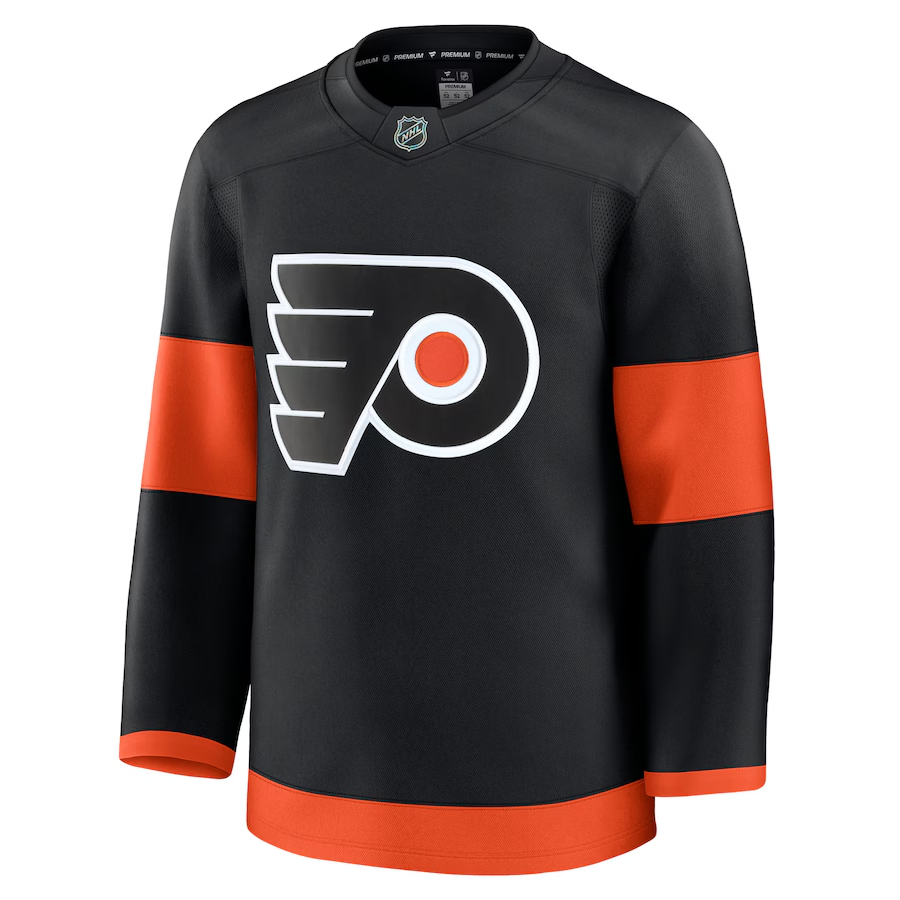
Flyers Jerseys
Flyers Leaders
Captain
Marcus Foligno
34 y/o, LW/RW,
USA
Alt. Captain
Ryan Strome
32 y/o, C/RW,
CAN
Alt. Captain
James van Riemsdyk
36 y/o, LW/RW,
USA
Player to Watch
Point Streak
Ryan Strome
Flyers
5 Game(s)
3G-8A-11P
This Month
Flyers Affiliation
Farm Team
Lehigh Valley Phantoms
Head Coach
Jared Boll
Conference
Eastern Conference
Division
Metropolitan Division
Arena Info
Stadium
Wells Fargo Center
Capacity
19,538
Attendance
16,065
Season Tickets
7,815
Team Popularity
110
Roster Info
Pro Team
23/23
Farm Team
31
Contract Limit
54/55
Prospects & Player's Rights
45
Nationalities
USA
7
CAN
7
FIN
3
RUS
2
DNK
1
SWE
1
GBR
1
CZE
1
Top Prospects
#7 (2024)
Berkly Catton
#12 (2025)
Kashawn Aitcheson
#25 (2023)
Dmitri Simashev
#27 (2023)
Ethan Gauthier
#29 (2024)
Alfons Freij
Salary Cap
Total Salaries
51,100,000$
Retains & Buyouts
3,510,000$
Actual Cap Hit
54,610,000$
Actual Cap Space
27,990,000$
Finance
Actual Income
52,275,191$
Actual Expenses
32,825,010$
Projected Income
79,380,846$
Projected Expenses
53,014,036$
Actual Bank Account
44,301,763$
Tickets
Section 100
130$ | 76.22%
Section 200
80$ | 76.60%
Section 300
45$ | 93.63%
Section 400
30$ | 95.33%
Suites
260$ | 71.25%
Team History
This Season
13-33-8 (34PTS)
Record (W-L-OTL)
626-522-136 (0.488%)
Playoff Appearances
8
Playoff Record (W-L)
67-55
Stanley Cup
1
Entry Draft


 Boston Bruins
 New York Rangers
 Los Angeles Kings
 Vegas Golden Knights


 USA
USA CAN
CAN


 FIN
FIN RUS
RUS DNK
DNK SWE
SWE GBR
GBR CZE
CZE